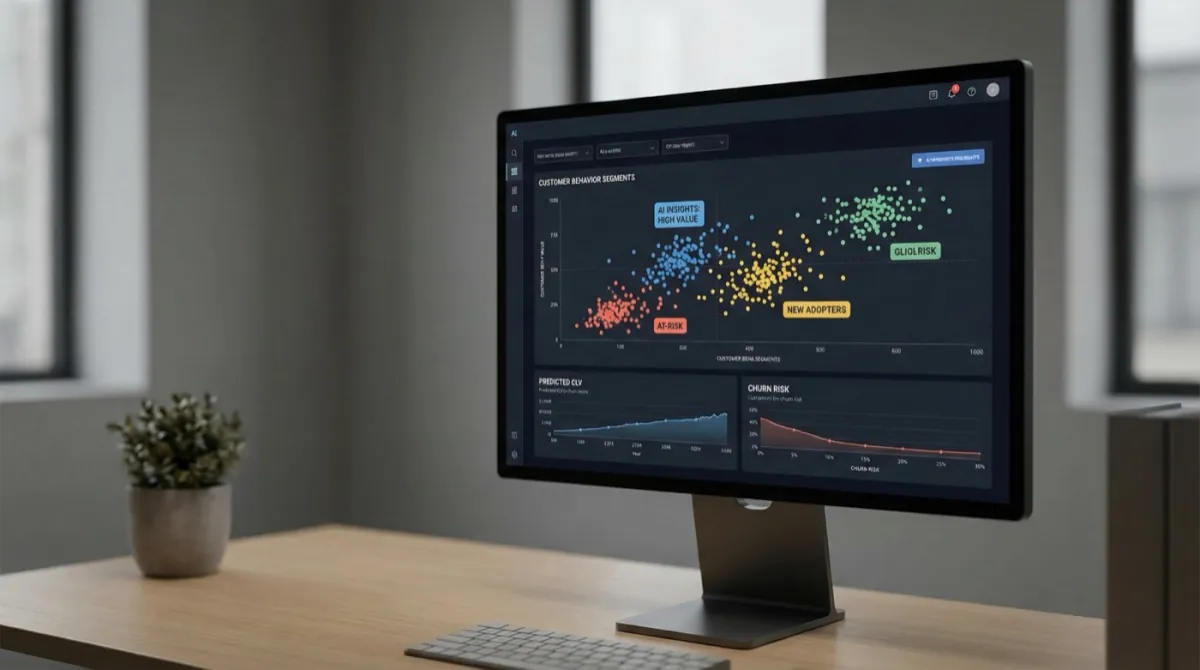
- Unsupervised clustering on 340,000 loyalty members found 14 segments where the marketing team had manually defined 6.
- Switching send-time alone for off-peak premium buyers lifted their revenue contribution by 18%.
- Cross-category samplers had 3.2x average lifetime value but looked like low-value occasionals under standard RFM scoring.
- Resist acting on every cluster: two of fourteen proved transient promo artifacts, visible only after a full quarter of observation.
The starting point
The retailer (a multi-category European chain, ~600M€ annual revenue) had what most CMOs consider a mature CRM: cleaned customer database, RFM scoring, six manually-defined segments ("VIPs," "loyalists," "occasionals," "lapsers," "newcomers," "discount-hunters"). Email campaigns mapped 1:1 to those segments. Open rates were declining 4-6% year over year.
The hypothesis: segmentation was too coarse. The marketing director couldn't articulate why a campaign that worked in March bombed in October. Same segment, different month, opposite results.
What we did
We pulled five years of transactional data, browse events, and contact-channel responses. ~1.2 billion rows. Engineered ~80 behavioral features per customer (basket diversity, day-of-week skew, channel preference entropy, return rate, response latency, etc.). Ran HDBSCAN to discover natural clusters without forcing a number.
The model surfaced 14 stable clusters: eight overlapping with the existing 6 segments, six entirely new.
The three profiles that changed the business
Off-peak premium buyers. Bought the highest-margin items, but only between 10pm and midnight on weekdays. Marketing was sending them morning campaigns. Switching send-time alone lifted their revenue 18%.
Cross-category samplers. Bought one item per category every 6 weeks. Looked like "occasionals" by RFM, but their lifetime value was 3.2x the average; they were just slow, methodical buyers. Discount-heavy campaigns were actively suppressing their purchases (they read it as "the brand is desperate"). Removing those campaigns lifted retention.
Stockout-frustrated lapsers. Customers who lapsed after attempting to buy an out-of-stock item three or more times. Existing flow treated them as "lapsed customers" with discount win-backs. The model showed these customers were not looking for discounts: they wanted notification when the item returned to stock. A simple "back in stock" alert re-engaged 34% of them.
Lessons
The team didn't lose to AI. The team had been right about the existing six segments. They just couldn't see the long tail: the customers whose behavior didn't fit the dominant patterns. That's exactly where unsupervised models earn their keep.
What didn't work: trying to explain every cluster. Two of the fourteen clusters looked statistically real but defied marketing interpretation. We let those sit unaddressed for a quarter; the data eventually showed they were transient (regional promo artifacts). Resist the urge to act on every cluster the model produces.
DNA Solutions expertise for your project
DNA Solutions unifies disparate data sources into central, high-performance querying environments. We build cloud data lakes, warehouses and streaming pipelines so your teams get real-time access to production information, without vendor lock-in.
Related services: Data & Analytics, AI & Machine Learning
Industry: Retail & Distribution